China to USA port to warehouse logistics spans 25–45 days door-to-warehouse. Your journey breaks into five stages: origin handling, ocean transit, port discharge, customs clearance, and inland trucking. Costs vary by route and season. For a 40-foot container, expect $3,500–$6,000 ocean freight plus $100–$500 for customs clearance. Your shipping method and port selection drive both speed and total expense.
Key Takeaways
Plan for 25–45 days total transit. Add 7–10 days of buffer during peak seasons and holidays.
Choose FCL for shipments over 15 cubic meters. It costs less per unit and reduces damage risk.
File customs documents before your vessel arrives. This step prevents costly delays and demurrage fees.
The Five Stages of the Journey
Every container moving from a Chinese factory to a U.S. warehouse passes through five distinct stages. Each stage carries its own timeline, cost structure, and risk profile. Understanding these stages helps you plan accurately and avoid costly surprises. The table below shows the typical time range for each stage of China to USA port to warehouse logistics.
Stage
Typical Time Range
Factory to export port
1–3 days
Export documentation and handling
1–4 days
Ocean transit
2–5 weeks
U.S. port handling and customs
2–7+ days
Port to warehouse
1–5 days
Total door-to-door
Approximately 3–7 weeks
Origin Port Handling in China
Your shipment begins at the factory. A truck picks up the cargo and delivers it to the export port. This leg takes one to three days for most suppliers in Guangdong, Zhejiang, or Jiangsu. Export documentation and terminal handling add another one to four days. Your freight forwarder books the container slot, submits the export declaration, and coordinates the gate-in process.
Delays at origin happen for several reasons. Equipment imbalances leave you without a container when you need one. Missed feeder connections push your cargo to the next vessel. Delayed departures cascade through your entire schedule. Longer actual transit times follow. These problems intensify during peak periods.
During peak season (August-October), port congestion can add several days to transit times. Pre-Chinese New Year rush (January-February) also experiences higher volumes and potential delays.
A reliable logistics partner manages these risks before they reach you. Balance Logistics maintains an in-house ground handling team for vehicle loading and cargo reinforcement. Their founding team brings 20 years of customs brokerage experience. This expertise covers HS code classification and export declaration support. Suppliers without export rights can use Balance's exporter to declare goods where regulations allow.
Specific port pairs show even tighter windows. Shanghai to Los Angeles runs 12–16 days. Shenzhen to Long Beach takes 13–17 days. Ningbo to Oakland requires 15–19 days. Qingdao to Seattle covers 14–18 days.
Carrier selection affects both speed and reliability. Balance Logistics cooperates with major ocean carriers on U.S. routes, including OOCL, EMC, ONE, and HMM. This carrier network supports capacity coordination during tight market conditions. Dynamic pricing helps you balance cost against transit time based on your specific route.
Destination Port Arrival and Discharge
Your vessel arrives at the U.S. port. Discharge typically takes one to three days. The terminal unloads your container and places it in the yard. Your customs broker files the entry summary with U.S. Customs and Border Protection (CBP). The container then waits for customs release before it can leave the terminal.
Port handling and customs together take two to seven or more days. Several factors influence this window. Terminal congestion slows container availability. Chassis shortages delay pickup. CBP holds extend the timeline significantly.
Free time matters here. Most terminals offer a limited number of free days for container storage. Demurrage charges begin after that period. You pay demurrage when the container sits at the terminal too long. Detention charges apply when you keep the container outside the terminal beyond the allowed time. Managing both requires tight coordination between your broker, trucker, and warehouse.
U.S. Customs Clearance Process
Customs clearance determines how quickly your cargo moves from port to warehouse. Clean documentation speeds release. Problems trigger holds and exams that add days or weeks.
Scenario
Typical Clearance Time
Notes
FCL, no issues
1 to 3 business days
Pre-filed entry, clean documentation
FCL, minor document correction
3 to 5 business days
Missing or incorrect commercial invoice details
LCL, no issues
2 to 5 business days
Deconsolidation adds time at the Container Freight Station
LCL, multiple consignees
3 to 7 business days
All consignees must clear before container is fully released
Any ocean shipment with CBP hold
5 to 15+ business days
Depends on examination type
Clearance speed depends on several controllable factors. Documentation answers questions upfront. Classification matches the actual product. Value aligns with supporting details. Importer responsibility stays clear. Proper documentation, such as IPRs and manufacturer information, can be quickly provided based on a request from customs. Responses arrive quickly and completely. All required PGA filings are submitted before arrival.
Several practices reduce clearance time. Clean, complete documentation means your commercial invoice, packing list, bill of lading, and any required certificates (FDA, USDA, FCC, etc.) all match and are filed before arrival. Correct HS codes determine the duty rate and whether any special permits are needed. Incorrect codes trigger reviews and potential penalties. Importer history matters because CBP tracks compliance through the Automated Commercial Environment (ACE) system. Importers with a clean track record are less likely to be flagged for examination. C-TPAT membership gives trusted importers, brokers, and carriers reduced examination rates and faster processing. C-TPAT members see roughly 4 to 7 times fewer inspections than non-members. Single window filing through ACE consolidates all government agency requirements (FDA, EPA, USDA, CPSC) into one entry, reducing the chance of holds from multiple agencies.
Different shipment types clear at different speeds. Express courier shipments clear same day to one business day. Air freight takes 24 to 72 hours. Ocean FCL clears in 1 to 3 business days after arrival, often less if pre-filed. Ocean LCL adds 1 to 3 days on top of FCL timing, since the whole container waits if any co-loader's goods get flagged.
Balance Logistics supports customs procedures involving U.S. Customs and Border Protection. Their team understands basic duties, anti-dumping duties, and countervailing duties. They also know local U.S. regulations including FDA and FMC requirements. This knowledge helps you prepare accurate documentation and avoid common holds.
Inland Transportation to Your Warehouse
The final stage moves your container from the port to your warehouse. This leg takes one to five days depending on distance and mode. Trucking dominates short hauls from West Coast ports to nearby distribution centers. Rail serves longer routes to Midwest and East Coast destinations.
Inland trucking covers the port-to-warehouse move directly. A drayage carrier picks up the container from the terminal and delivers it to your facility. Rail involves an extra step. The container moves by rail to an inland hub, then transfers to a truck for final delivery. Rail costs less for long distances but adds transit time.
Accessorial charges often appear at this stage. Liftgate service, inside delivery, and residential delivery all carry extra fees. Waiting time at the warehouse also generates charges. You can avoid these by preparing your receiving dock and scheduling delivery appointments in advance.
Balance Logistics provides U.S. inland trucking and final-mile delivery through dedicated trucking teams. Their coverage spans major U.S. ports and inland cities. Overseas warehousing resources support localized distribution when you need inventory positioned closer to your customers. Final-mile deliveries may be performed by different service providers, including national couriers such as UPS, FedEx, and USPS.
Shanghai to Los Angeles remains the fastest lane at 12–16 days. Shenzhen to Long Beach follows closely at 13–17 days. East Coast routes take much longer. Shanghai to New York runs 28–38 days through the Panama Canal. Savannah and Charleston add similar time.
Seasonal Disruptions: Chinese New Year and Golden Week
Chinese New Year and Golden Week disrupt your schedule every year. Plan around these predictable events.
Pre-holiday volume surges fill available freight space three to four weeks before each holiday. Rates climb for ocean and air shipping.
Port staff vacations reduce loading, customs, and scheduling efficiency. Cargo backlogs and ship queuing follow.
Domestic transportation demand spikes as businesses stockpile goods. Road, rail, and air capacity tightens.
Smart buffer planning protects your inventory. Add 7–10 days to quoted transit times during known disruptions. Order 60–75 days ahead for ocean freight total lead time. Peak seasons and holidays require 14–21 extra days. This approach keeps your China to USA port to warehouse logistics predictable.
Full Cost Breakdown
Understanding the complete cost picture for China to USA port to warehouse logistics requires examining each expense layer separately. Most importers focus on the ocean freight quote, but that number represents only a fraction of your true landed cost. The full breakdown includes ocean freight, terminal handling, customs duties, brokerage fees, inland transportation, and a range of accessorial charges that appear after your cargo arrives.
Ocean Freight and Terminal Handling Fees
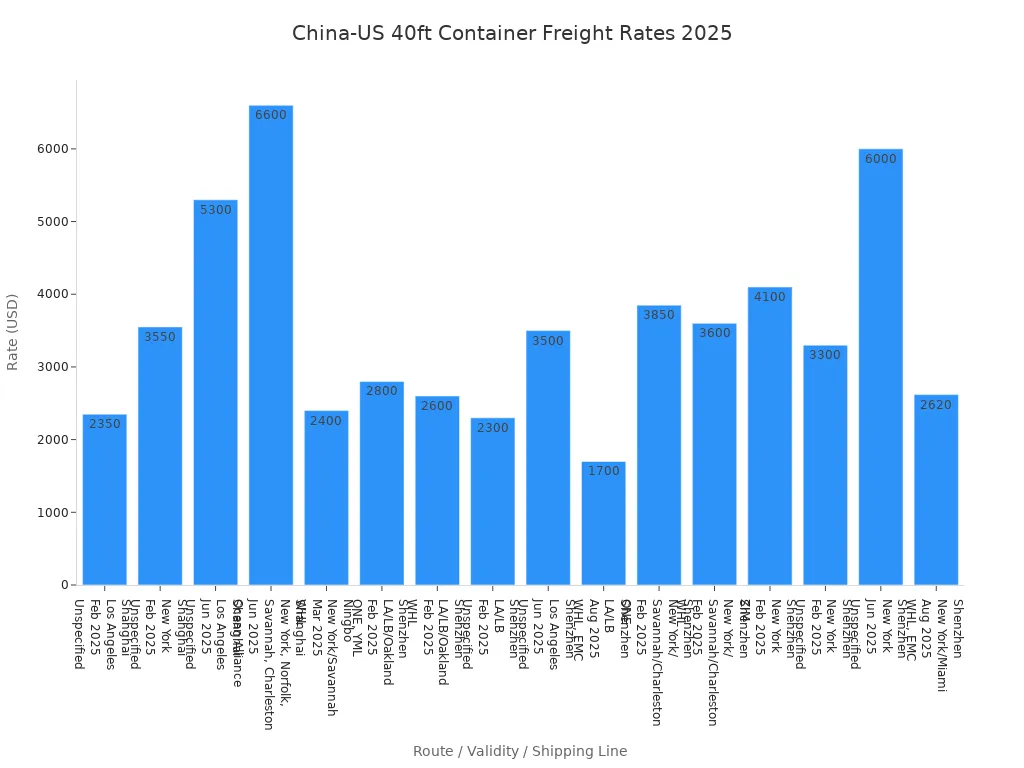
Ocean freight dominates your shipping budget. Rates fluctuate with market conditions, season, and route. The table below shows representative 2025 rates for 40-foot containers from major Chinese ports to U.S. destinations.
Origin (China)
Destination (US)
40GP/40HQ Rate (USD)
Validity / Date
Shenzhen (Yantian/Shekou)
Los Angeles / Long Beach
1,700
2025-08-18 to 2025-08-31
Shenzhen (Yantian/Shekou)
New York / Miami
2,620
2025-08-18 to 2025-08-31
Shenzhen (Yantian/Shekou)
Los Angeles / Long Beach / Oakland
2,800
Feb 2025
Shenzhen (Yantian/Shekou)
New York / Savannah / Charleston
3,850
Feb 2025
Shanghai
Los Angeles
2,350
2025-02-18
Shanghai
New York
3,550
2025-02-18
Ningbo
New York / Savannah
2,400
2025-03-30
These rates represent ocean freight only. They exclude terminal handling charges, AMS filing fees, and other local surcharges. Your freight forwarder quotes a base rate, then adds origin charges, destination charges, and documentation fees. Terminal handling charges cover the movement of your container on and off the vessel. Ports in China and the United States each assess their own fees.
Carrier selection influences your rate significantly. Balance Logistics maintains relationships with major carriers including OOCL, EMC, ONE, and HMM. These relationships provide access to competitive pricing and capacity during tight markets. Dynamic pricing allows you to balance cost against transit time based on your specific route requirements.
Customs Duties, Tariffs, and Brokerage Fees
Customs duties represent a substantial portion of your total cost. The U.S. applies multiple tariff layers to Chinese imports. Your product's HTS code determines which rates apply. The table below shows how these layers stack for a typical $25,000 shipment.
Note: Section 232 and forced labor Section 301 do not stack. If Section 232 applies, the forced labor Section 301 does not. The example shows both for illustration; verify which applies to your specific product.
Different product categories face different tariff structures. Bluetooth speakers carry a free base duty rate under HTS 8518.22.00, but Section 301 List 4A adds 7.5%. Products on Lists 1, 2, or 3 face a 25% Section 301 charge. Steel and aluminum products face a 50% Section 232 duty, raised from 25% on June 4, 2025. Derivatives face 50% or 25% on a full-value basis since April 6, 2026.
Beyond duties, you pay government fees on every import. The Merchandise Processing Fee (MPF) applies at 0.3464% of your shipment value. The Harbor Maintenance Fee (HMF) adds 0.125% for ocean shipments. The de minimis exemption for China and Hong Kong ended on May 2, 2025, so even small shipments now face full entry requirements.
Customs brokerage fees range from $150 to $300 or more per entry. This fee covers the broker's work preparing your entry documentation, filing with CBP, and coordinating any examinations. Balance Logistics brings 20 years of customs brokerage experience to this process. Their team handles HS code classification and understands basic duties, anti-dumping duties, and countervailing duties. They also know local U.S. regulations including FDA and FMC requirements.
Inland Trucking, Rail, and Accessorial Charges
Inland transportation moves your container from the port to your warehouse. Trucking serves short distances from West Coast ports. Rail handles longer routes to Midwest and East Coast destinations. Each mode carries its own cost structure.
Drayage trucking charges vary by distance and market. A short haul from Los Angeles to a nearby warehouse might cost $300 to $500. Longer moves to inland destinations run $800 to $1,500 or more. Rail moves cost less per mile but add transit time and require an additional truck move from the rail hub to your warehouse.
Accessorial charges appear throughout the inland leg. Liftgate service adds $50 to $100 when your warehouse lacks a loading dock. Inside delivery costs extra when you need cargo placed beyond the receiving area. Residential delivery carries a premium over commercial addresses. Waiting time at your warehouse generates hourly charges when trucks sit idle.
Chassis usage affects your drayage bill significantly. Some carriers include chassis in their rate. Others charge separately. Chassis rental, chassis split, and maintenance-related terms all inflate your final invoice. You need to know whether your quote includes chassis or bills it at actual cost.
Hidden Costs That Inflate Your Total
Hidden costs often exceed your quoted freight rate. Demurrage and detention represent the most common surprises. Demurrage accrues when your container exceeds its free time while sitting on a marine terminal. Customs delays, import documentation problems, and lack of trucking capacity all trigger demurrage charges. Detention applies when you keep the carrier's equipment beyond the allowed time after pickup. Warehouse unloading delays and late empty returns cause detention fees.
Port congestion creates a cascade of hidden costs. The process follows a predictable pattern:
Port congestion occurs at the U.S. gateway.
Trucks wait longer to pick up containers.
Drayage charges rise due to the extra time.
Appointments are missed.
Cargo is placed into storage.
Detention and demurrage begin to accrue.
Inventory becomes available later than planned, adding carrying cost or stockout risk.
This delay propagation principle matters more than individual line items. A small original delay can produce a much larger combined storage, drayage, detention, or handling bill. You cannot control port congestion directly, but you can prepare for it.
Carrier comparison requires a total-cost approach. A lower ocean rate often comes with shorter free time. A higher rate may include longer free days that protect you when delays occur.
Comparison Factor
Carrier A
Carrier B
Ocean rate
Lower
Higher
Free time
Shorter
Longer
Total-cost profile
May be worse if customs/warehouse timing is unpredictable
May be better when delays are likely
You should normalize every cost category when comparing carriers. Ocean freight provides the base rate. Origin pickup, origin charges, and documentation reveal excluded costs. Destination charges expose terminal costs. Customs brokerage separates government fees from service fees. Drayage, rail, and chassis capture inland equipment and movement costs. Surcharges reflect peak-season and route-specific add-ons. Free time days compare your delay exposure. An accessorial reserve budgets for demurrage, detention, and storage. The estimated total gives you the true basis for your award decision.
The formula for true shipment cost follows this logic: True Shipment Cost = Quoted Freight + Excluded Charges + Expected Accessorials + Import Costs + Inland Costs + Delay Exposure. Apply this formula to every quote you receive. The lowest ocean rate rarely produces the lowest total cost.
Working with an experienced logistics partner helps you identify and control these hidden costs. Balance Logistics provides end-to-end visibility across your shipment. Their U.S. warehousing network and dedicated trucking teams reduce delay risk. Their customs expertise prevents documentation errors that trigger holds. Their carrier relationships secure competitive rates with favorable free time terms. This combination keeps your China to USA port to warehouse logistics predictable and cost-effective.
FCL vs. LCL: Making the Right Choice
Your shipment volume determines whether FCL or LCL makes more sense. Full Container Load (FCL) means you book an entire container. Less than Container Load (LCL) means you share container space with other shippers. This single decision shapes your cost, speed, and cargo risk.
Cost Comparison by Shipment Volume
LCL pricing works on a per-cubic-meter basis. You pay only for the space your cargo occupies. This structure favors small shipments under 15 cubic meters. FCL pricing covers the whole container regardless of how much you fill. Once your volume crosses roughly 15 cubic meters, FCL usually costs less per unit. You also avoid the consolidation fees and destination deconsolidation charges that LCL adds.
Speed, Handling, and Damage Risk Differences
Factor
FCL
LCL
Transit time
Faster — direct port-to-port, no consolidation stops
Minimal — sealed container, loaded once and unloaded once
Multiple touches at origin and destination CFS
Cargo damage rates
Lower — cargo travels alone in a sealed container
Slightly higher — shared space and frequent handling
High-value shipments traveling LCL carry a higher risk of partial damage during CFS handling, since cargo is loaded and unloaded more frequently than in an FCL container.
Best Use Cases for Each Shipping Method
Choose LCL for small or medium shipments, new product tests, and flexible volumes.
Choose FCL for large volumes, fragile goods, and full pallets.
Balance Logistics offers customized FCL and LCL solutions. Their team helps you match shipping cost against transit time for your specific route.
Provides detailed information about the goods (description, quantity, selling price, country of origin); used by customs to assess duties and taxes. Must be accurate and complete.
Packing List
Details the packing of the shipment (number of packages, contents of each package, weight and measurements); used by customs during inspection. Must match actual shipment contents.
Bill of Lading (BOL)
Contract between the goods owner and the carrier; serves as receipt, contract of carriage, and document of title. Contains carrier name, date/place of receipt, destination, and delivery terms.
Customs Bond
Contract ensuring all duties, taxes, and fees owed to the U.S. government will be paid. Required for all commercial entries valued over $2,500. Two types: single entry bond (one shipment) and continuous bond (all shipments within one year).
Arrival Notice
Notifies the consignee of the goods' arrival; includes description, vessel name, voyage number, bill of lading number, and arrival date.
The commercial invoice and packing list carry the most weight. They must clearly show what you import, the quantity, value, currency, buyer, seller, Incoterm, and product description. Vague descriptions such as "accessories," "parts," or "goods" create clearance issues. A customs bond must be on file before formal entry processing begins. Without one, your shipment sits at the port.
HTS Codes and Duty Rate Classification
Your product's Harmonized Tariff Schedule code determines your duty rate. Getting this code right matters more than most importers realize. A minor code change can produce a major cost increase.
Common misclassification risks include guessing codes based on similar products, relying on supplier-provided codes without verification, and misinterpreting HTSUS terms that carry specific legal definitions. Products from China face additional scrutiny because Section 301 tariffs still apply to most categories.
You can protect yourself through several practices. Engage experienced customs brokers who demonstrate due diligence. Utilize CBP's CROSS database to research prior rulings for similar goods. Maintain detailed technical documentation, including product specifications and component breakdowns. Train your internal staff on classification fundamentals. These steps demonstrate reasonable care and reduce your exposure to penalties.
Prevention starts before your cargo ships. Identify which Partner Government Agencies cover your product category. File required documentation, such as FDA prior notice or FCC ID, before departure. Confirm product labeling meets agency requirements at origin. Search the USITC ADD/CVD orders database by HTS heading and country of origin. Verify country-of-origin marking on the goods themselves. Screen your suppliers against the UFLPA Entity List regularly. These proactive steps keep your China to USA port to warehouse logistics moving without interruption.
What Causes Delays and How to Prevent Them
Delays rarely come from a single source. They build from congestion, disruptions, and paperwork errors. You can prevent most of them with early planning.
Peak Season Congestion at Major Ports
Peak season runs from August through October. Holiday inventory floods the trans-Pacific lanes. Los Angeles and Long Beach absorb the heaviest volume. Vessels wait at anchor. Terminals run out of chassis. Your container sits longer than planned. Book your space four to six weeks ahead during these months. Reserve trucking appointments before your vessel arrives.
Port Strikes, Weather Events, and Equipment Shortages
ILA and USMX reached a tentative agreement in early January, averting a strike, but supply chain impact is still normalizing.
Cargo diversions caused by strike threat put pressure on USWC routing; congestion will take time to ease.
Pacific Weather Events
Adverse weather in Asia and severe typhoon season are contributing to congestion and delays.
Asia and USWC port congestion is creating significant shipping delays; ports like Los Angeles and Long Beach face weather-related delays, leading to extended wait times and increased costs.
Container Equipment Shortages
Sudden surge of cargo from non-Chinese locations has the potential to cause equipment shortages as repositioning of empty containers was not planned for such an event.
This reduces capacity in China where bookings are dropping while increasing capacity in other locations, making supply/demand unpredictable at a port level.
"The element shippers should be mindful of is that this sudden non-Chinese surge has the potential to cause equipment shortages, as the repositioning of empty containers have not planned for such an event."
Customs Exams and Documentation Errors
Customs holds extend your timeline by days or weeks. Most holds trace back to preventable mistakes. Review these common triggers before you ship.
Documentation inconsistencies on CBP Form 7501, including mismatches between the bill of lading or commercial invoice and the entry summary, a PO Box instead of a physical address, or an incorrect HTS code.
Product admissibility or regulatory flags from Partner Government Agencies that require extra paperwork or licensure for regulated goods.
Targeting or risk flags, including shipments suspected of prohibited items or sourced from regions under sanctions such as the UFLPA.
Physical exams, including X-ray, tail gate, or devanning, when a hold cannot be resolved with corrected documents.
Inconsistent quantities, weights, or product names across the invoice, packing list, and shipping documents.
Missing importer details such as business, tax, or contact information.
Incorrect HTS classification.
Vague product descriptions like "parts," "goods," or "accessories."
Value mismatches or country-of-origin errors.
A small importer shipping finished goods from China confirmed product details, checked description, value, quantity, and origin before shipment, and had the logistics team review documents before departure. This preparation produced smoother clearance. You can do the same. Verify every field before your cargo leaves the factory.
Cost-Saving Strategies That Actually Work
Smart planning cuts your total China to USA port to warehouse logistics bill. You control three levers: port selection, consolidation, and free time management.
Choosing the Right China-U.S. Port Pair
Your port pair drives both transit time and inland cost. West Coast ports offer faster ocean transit at 12–18 days. East Coast routes take 28–38 days but place inventory closer to eastern markets. Compare your total landed cost for each option. A cheaper ocean rate to Los Angeles may cost more after cross-country rail. Match your port to your warehouse location and customer base.
Consolidation Strategies and Carrier Negotiation
You gain leverage through consolidation and smart contract terms.
Use LCL shipping to share container space when your order falls between 2–10 cubic meters. This adds 3–7 days to transit but lowers per-unit cost.
Choose FOB terms to control shipping from the Chinese port and select your own forwarder.
Time shipments for March through June to avoid peak season rate spikes.
Balance Logistics offers customized FCL and LCL solutions. Their carrier relationships with OOCL, EMC, ONE, and HMM support competitive pricing.
Managing Free Time to Avoid Demurrage and Detention
Demurrage and detention charges escalate fast. Track your last free day (LFD) for every container.
Submit customs declarations before vessel arrival. Prioritize pickups by LFD, not container age. Coordinate street turns to reuse containers where carrier rules allow. These steps keep your cargo moving and your costs down.
2026 Trends Reshaping China-U.S. Shipping
Tariff Policy Shifts and Trade Agreement Updates
Tariff policy remains your biggest cost variable in 2026. New Section 301 investigations into excess-capacity allegations cover 16 economies, including China. Several outcomes could reshape your import costs:
A new round of U.S. tariffs on Chinese goods may follow the completed investigations.
The administration may widen the tariff gap between China and other major suppliers, such as India.
The Board of Trade agreement opened a public-comment process to identify a $30 billion list of goods, signaling possible tariff reductions.
The Chinese government stated in July 2026 that the Trump administration committed to keep new U.S. tariffs on China, including the 12.5 percent forced-labor Section 301 tariff, at or below 20 percent.
The key variable for your import costs is the size of product-level tariff differentials between China and alternative source countries.
Automation and Digitalization at Major Ports
Major ports continue investing in automated terminals and digital booking systems. These upgrades shorten gate times and reduce paperwork errors. You benefit from faster container availability and more predictable pickup windows. Adopt digital documentation early to capture these gains.
Nearshoring Alternatives and Route Diversification
Nearshoring to Mexico changes your landed-cost math. Compare the two sourcing models directly:
Fast replenishment, heavy goods, tariff-exposed categories
Complex electronics, deep component supply chains
On ex-factory price, nearshoring is usually not cheaper than offshoring — but on landed cost it often is. Mexico-origin goods meeting USMCA rules enter the US at 0% duty while many China-origin categories carry an effective 29.5%–33% load, and overland freight runs $600–$2,700 versus $4,000+ per trans-Pacific container. Add lower inventory carrying costs and nearshoring frequently wins the total.
You can predict your China to USA port to warehouse logistics timeline when you plan all five stages and add buffer time for seasonal disruptions. FCL saves money per unit above 15 cubic meters, while LCL fits smaller, flexible volumes. Your biggest savings come from smart port selection, booking 4–6 weeks ahead, and filing customs documents before vessel arrival. Track every milestone from origin gate-in to warehouse receipt. Early tracking catches delays before they become stockouts or missed sales windows.
FAQ
How long does China to USA port to warehouse shipping take?
Plan for 25–45 days door-to-warehouse. Ocean transit alone takes 12–30 days. Add 1–3 days for port discharge, 1–5 days for customs, and 2–7 days for inland trucking.
What drives the total cost of shipping from China to a U.S. warehouse?
You pay $2,500–$6,000 per 40ft container all-in. Ocean freight, duties, brokerage, and inland trucking drive the total. Port pair, season, and inland distance change your final number.
Should you choose FCL or LCL for your shipment?
Choose FCL above 15 cubic meters. You get lower per-unit cost, faster transit, and less handling damage. Choose LCL for smaller, flexible volumes under 15 cubic meters.
 +86 13808855822
  E-MAIL:info@szbalance.com